Retain Cycles in Swift
Once you get past your initial introduction to Swift and iOS development and start working on a bigger project - especially if you don’t already have a background in programming - you will probably hit your first intermediate level problem: Memory management and retain cycles.
What causes retain cycles?
To answer this, it is required to understand how Automatic Reference Counting (ARC) works. It can be summarized with four simple sentences:
- ARC tracks how many properties, constants, and variables are currently referring to each class instance
- When this number reaches 0, the memory used by the class instance is freed up
strongreferences increase this numberweakandunowneddo not increase this number
Any reference that doesn’t have the weak or unowned keyword is a strong reference.
To better understand this, I read a great analogy some years ago:
strongis like “a dog on a leash”. You are holding the leash, so the dog won’t run away.weakandunownedare like “pointing at a dog”. As long as someone else is holding the leash, the dog won’t run away.
Going back to the dog analogy before, if you have three dogs tied to one another with a leash, neither dog will be able to run away.
Or in code:
class BlackDog {
    var otherDog: BrownDog?
}

class BrownDog {
    var otherDog: GrayDog?
}

class GrayDog {
    var otherDog: BlackDog?
}

func createCycle() {
    let blackDog = BlackDog()

    let brownDog = BrownDog()
    blackDog.otherDog = brownDog

    let grayDog = GrayDog()
    brownDog.otherDog = grayDog

    // This is the step that seals the cycle
    grayDog.otherDog = blackDog
}
NOTE: You can think of closures also as objects.
To break the cycles, you need to replace any one of the references with weak or unowned. I plan to cover the difference between the two in my next article. For now, I would recommend using weak.
For example:
class GrayDog {
    weak var otherDog: BlackDog?
}
How to debug retain cycles?
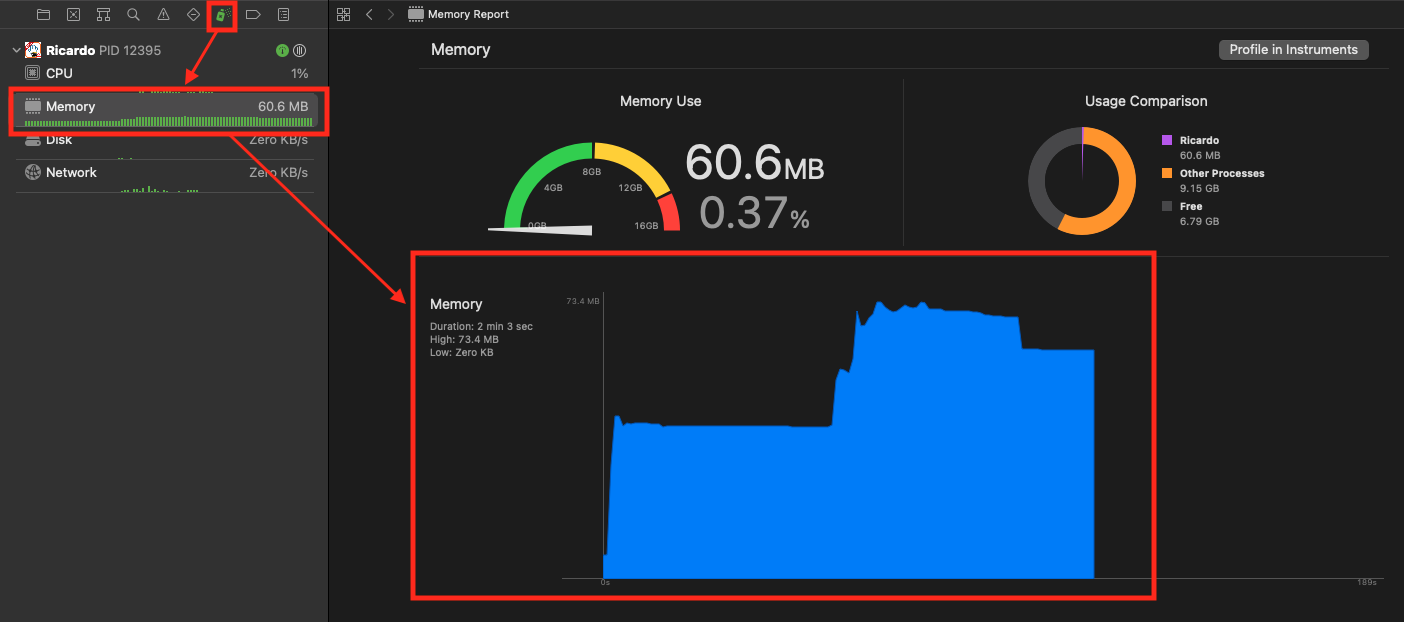
The simplest and fastest way I’ve found to check if my project has retain cycles is by using Xcode’s built in Memory Debugger.

- Run your app and look at the memory usage
- Navigate through your app, trying to get to each possible screen
- Close every screen and go back to the starting point
- With the Simulator in focus, hit ⌘⇧M (Cmd + Shift + M), or Debug -> Simulate Memory Warning;
This is important in case you are using any sort of caching library (ex: Kingfisher), because they usually have an in-memory cache as well.
- Check the memory graph and compare it with the value from step 1.
- If there is a significant discrepancy, open up the Memory Graph and check for any suspicious items
The fact that there is a difference in memory does not necessarily indicate that there are retain cycles. It could be that some objects (usually Singletons) got allocated later than app start. I recommend repeating steps 2. and 3. to see if there’s an increase in memory every time.

You can use the button highlighted with yellow to hide Apple’s frameworks and only see objects that are in your workspace.
I usually start by looking at ViewControllers, then components of my architecture (ex: ViewModel, Coodinator) and finally Services which are not Singletons.
Conclusion
Hopefully now you have a better understanding of what causes retain cycles and how to debug them.
As always, I would love to hear your thoughts and suggestions. Feel free to get in touch at moc.htikmsofi@gomlb!